
SEO
What Is Anchor Text? A Simple Guide for Beginners (2026)
Anchor text is the clickable text in a link. Learn what it is, the 9 types, good and bad examples, and how to check your own anchor text profile.

 By Taylor Orlando
·November 21, 2026
A website speed test tells you how fast your website loads and what is slowing it down. You paste your page address into a free tool, wait a few seconds, and get a score plus a list of problems to fix. It is one of the simplest checks a small business owner can run, and it matters: slow pages lose visitors, hurt sales, and rank lower on Google.
This guide shows you how to run a website speed test for free, how to read the results in plain English, and what to fix first when the score is bad. You do not need any technical skills. If you can copy and paste a web address, you can do this.
A website speed test loads one of your pages the way a real visitor’s browser would, times every step, and reports the results. It measures things like how long the page takes to show its main content, how quickly it responds when someone clicks, and whether the layout jumps around while it loads.
Most tests give you two kinds of numbers. The first is a score, usually out of 100, that sums up the page in one number. The second is a set of timings for the separate parts of the load, such as the server response, the largest image, and the JavaScript files. The score tells you how you are doing. The timings tell you what to fix.
One thing to clear up first: a website speed test is not the same as an internet speed test. An internet speed test measures your own connection, like your home Wi-Fi. A website speed test measures your website, no matter whose connection opens it. If your site is slow for visitors, a faster internet plan at your office will not fix it.
Google’s PageSpeed Insights is the best place to start because it is free, needs no sign-up, and uses the same measurements Google uses for ranking. Here is how to run it.
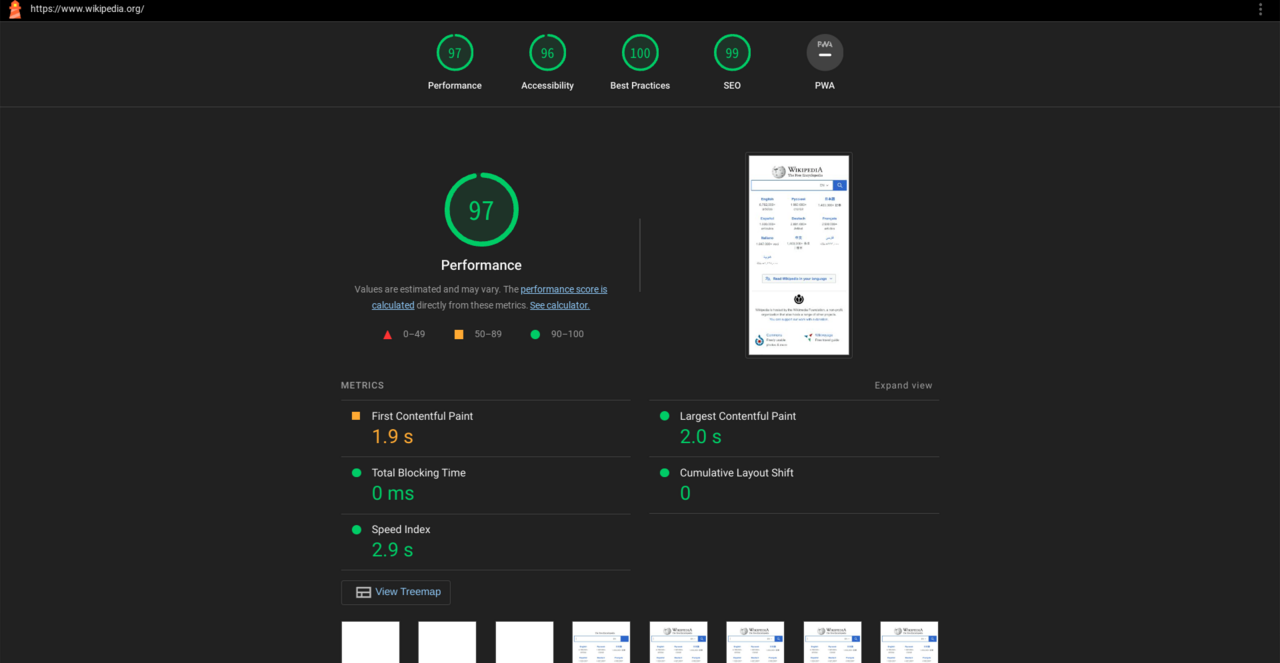
That is the whole process. You can repeat it for any page on your site, and you can run it again after you make changes to see if the score moved. There is no limit on how many pages you can test this way.
PageSpeed Insights is a good default, but other free tools show you things it does not. Each one below is free for a one-off test with no payment details. Try two or three and compare what they say.
The free tool from Google at pagespeed.web.dev. It gives you a score out of 100 for mobile and desktop, the three Core Web Vitals, and a list of fixes ranked by time saved. It also shows real visitor data from the past 28 days when your page gets enough traffic, which tells you how the page performs for actual people rather than in a lab. Best for: a first test and for anything tied to Google ranking.
A free test at gtmetrix.com that grades your page from A to F and shows a waterfall chart, which is a timeline of every file your page loads. You can pick the test location and device, and a free account lets you save past results so you can compare them over time. Best for: seeing exactly which file is slow.
A simple free test at tools.pingdom.com. Paste a URL, pick a location, and get a load time, a page size, and the number of requests. Its waterfall chart is one of the easiest to read, and it explains each file type and server response code in plain words. Best for: a quick check when you want the answer in under a minute.
A free, in-depth test at webpagetest.org. It runs your page on real browsers and real devices, and it can test from many locations around the world. The report is more detailed than the others, with filmstrip screenshots that show how the page appears second by second. Best for: a deep check when other tools disagree or when you want to test a slow connection.
A free test at debugbear.com that focuses on Core Web Vitals and explains each metric in plain language. It shows how your page compares with typical sites and lists more than 25 common performance problems with guidance on each. Best for: understanding Core Web Vitals without reading a developer manual.
A speed test report can look like a wall of numbers. You only need to understand five of them.
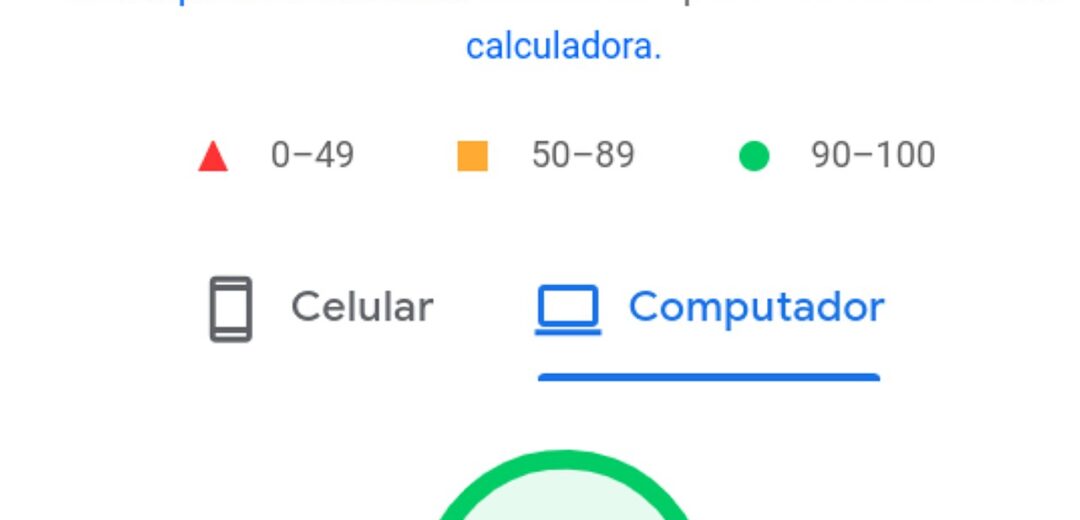
Most tools show a performance score from 0 to 100. Google’s own bands are simple: 90 to 100 is good, 50 to 89 needs work, and below 50 is poor. A score in the 90s is a solid goal for a small business site. A perfect 100 is nice but not required, and chasing it can cost more time than it is worth.
Google measures real user experience with three metrics called Core Web Vitals. Each one has a published good, needs improvement, and poor range. These are the numbers that matter most for ranking.
| Metric | What it measures | Good | Needs improvement | Poor |
|---|---|---|---|---|
| LCP (Largest Contentful Paint) | How long the biggest visible piece of content takes to appear | 2.5 seconds or less | 2.5 to 4.0 seconds | Over 4.0 seconds |
| INP (Interaction to Next Paint) | How fast the page reacts when someone clicks or taps | 200 ms or less | 200 to 500 ms | Over 500 ms |
| CLS (Cumulative Layout Shift) | How much the page layout jumps around while loading | 0.1 or less | 0.1 to 0.25 | Over 0.25 |
In plain words: LCP is about speed, INP is about responsiveness, and CLS is about stability. A page passes when at least 75 out of 100 real visits hit the “good” range for all three. You can read the full definitions on Google’s Core Web Vitals guide.
Three more timings often appear in reports. TTFB (time to first byte) is how long your server takes to answer at all; under 800 ms is a common target, and under 200 ms is fast. FCP (first contentful paint) is when the first text or image shows up. Speed Index is how quickly the visible parts of the page fill in. If your Core Web Vitals are good, these supporting numbers usually look fine too, so fix the big three first.
Most tools show a waterfall: a row for every file the page loads, in the order it loads them. Long bars are slow files. Look for the longest bars first. They are usually a large image, a video, a font file, or a third-party script such as a chat widget or ad code. That is where your time is going.
Almost every site scores lower on mobile than on desktop, and that is normal. A phone has a slower processor than a laptop, and a mobile connection is slower and less steady than office Wi-Fi. The test also simulates a mid-range phone on a 4G connection, not the newest phone on fast Wi-Fi, so the mobile number is deliberately harsh.
Do not panic about the gap itself. What matters is the mobile score, because Google ranks your site based on its mobile version. If your mobile score is in the 90s, you are in good shape even if desktop is only a little higher. If mobile is in the 50s while desktop is in the 90s, your mobile visitors are getting a much worse experience than your desktop visitors, and that is where to focus.

Run the same page through PageSpeed Insights, GTmetrix, and Pingdom and you will get three different numbers. That does not mean any of them is wrong. Each tool tests under different conditions.
Because of this, compare scores only from the same tool, tested the same way. If you want to track progress, always use the same tool, the same page, the same location, and the same device setting.
Do not test only your homepage. Visitors land on many pages, and a slow page that brings in sales hurts more than a slow page nobody visits. Test these first:
Five pages is a good first round. Test one, fix the biggest problem, then move to the next. You do not need to test every page on your site to get most of the benefit.
One test is not enough to judge your site, because a single run can be thrown off by a busy server or a slow third-party script. Run each test two or three times and take the middle result. Then follow a simple routine:
If you want the tests to run themselves, most of the tools above sell monitoring plans that test your site every day or every hour and alert you when it slows down. For most small businesses, a manual monthly check is enough.
A long list of problems can feel overwhelming. Work in this order, because the items at the top usually save the most time.
Fix one item, then run the test again under the same conditions. If the score moved, you know the fix worked. If it did not move, move on to the next item on the list.
Every tool in this guide is free for a one-off test, and a one-off test is all most small businesses need. Paid plans add things you only need once your site gets bigger: automatic tests every hour, alerts when the site slows down, a history of past scores, and tests from many locations at once.
Here is the simple rule. If you test your site by hand once a month, the free versions are enough. If speed directly affects your income, for example on an online store, a paid monitoring plan is worth considering because it catches a slowdown the same day it happens instead of at your next monthly check.
It is a free online check that loads one of your pages and measures how fast it appears, how quickly it reacts to clicks, and how stable the layout is while it loads. You get a score and a list of problems to fix.
No. It checks your website, not your connection. Your site can be slow for visitors even when your own internet is fast, and your site can be fast even on a slow connection. To test your internet connection, use a different tool such as an internet speed test.
Aim for the largest visible content to appear within 2.5 seconds, which is Google’s “good” line for LCP. As a rough guide, a full page load under 3 seconds is good, 3 to 5 seconds needs work, and over 5 seconds will cost you visitors. For server response alone, under 200 ms is fast, 200 to 500 ms is acceptable, and over 1 second needs attention.
Phones have slower processors and slower, less steady connections than desktop computers, and speed tests simulate a mid-range phone on 4G. Google also ranks your site on its mobile speed, so fix the mobile result first.
Run a test after every change to your site, such as a new plugin, new images, or a redesign, and do a quick check of your five most important pages once a month. Always run each test two or three times and use the middle result, because a single test can be thrown off by a temporary slowdown.
No. PageSpeed Insights, GTmetrix, Pingdom, WebPageTest, and DebugBear all let you run a one-off test without an account. A free account is useful if you want to save past results, and paid plans add automatic monitoring and alerts.
Last updated: November 2026

Taylor Orlando is a content writer at Meregate covering websites, SEO, and AI. Taylor breaks down complex topics into simple, practical guides that help small businesses build better websites, rank higher on Google, and get real value from AI tools — no jargon, no fluff.
Anchor text is the clickable text in a link. Learn what it is, the 9 types, good and bad examples, and how to check your own anchor text profile.

A bad robots.txt file can hide your whole site from Google. This guide shows how to test it in Search Console, check single pages, and avoid the most common mistakes.

Verification proves to Google that you own your site. This guide walks through the DNS record, HTML file, HTML tag, Analytics and Tag Manager methods, and what to do when verification fails.